Tag Archives: performance

Measuring the response bytes using jmeter

If you want/need to measure the response bytes size from the jmeter results and analyze/get the trends. Following will help

Make sure you disable the flag “Keep-alive” in your HTTP request. (Found that enabling this can skew the payload size that jmeter reports. In a thread, if the request is made multiple times jmeter tool provides the cumulative payload size instead of the individual request response bytes. )

If you create CDF for this bytes data, the graph is a straight line with very high payload data which is ever increasing. Unless you need the keep-alive for your request, disable it in your http request.

Leave a comment

Filed under JMeter

Hugepages and Java

As a data point, at a previous employer we played a little with the use of HugePages and memory mapped files in an attempt to get better performance.
Java’s support for the use of HugePages is on a best effort basis and our experimentation found that java was initially using the HugePages, but over time (a few hours), the HugePages were no longer used by the JVM—thus effectively reducing the available amount of RAM by the amount allocated for HugePages. We ended up disabling HugePages for our usage. I do not recall any concern/investigation about the Anonymous huge pages.
 
In the above case, however, we were constantly changing the memmapped files (these were large image files), since each request would access different image files, and the files were accessed over network storage.

Leave a comment

Filed under JVM, Linux

Performance impact of dirty pages in Linux

Memory (RAM) is divided into pages of equal size. A page is the smallest unit of memory that can be manipulated.

My Tech Project Notes describes Dirty Pages as

Dirty pages are the pages in memory (page cache) that have been updated and therefore have changed from what is currently stored on disk. This usually happens when an existing file on the disk is modified or appended.

Page cache on a Linux system is the area where filesystem based I/O is cached and that these settings affect how the cache is utilized by the kernel.

We can tune pdflush to determine how much RAM based cache to use for (dirty pages) data targeted to disk and how frequently to flush that cached data by writing the pages back to disk.

There are two types of flush to disk in Linux and parameters / ratios controlling how often they are triggered

1. Stop the world – Controlled by dirty_ratio.

This is the Big ass flush, that will lock the memory during the flush, the ditry_ratio determines the threshold based on the total size of the Memory/Dirty page Cache  ( Dirty page cache size is not the same as total RAM size, its usually less than total RAM size)

For example, if the dirty_ratio is set to 20%, or 0.2, a “stop the world” flush is invoked when the dirty page cache is  20% full.

2. Background Flush – controlled by dirty_background_ratio

This is a intrusive flush, similar to CMS in JVM, which happens in parallel and does not block the memory for reads and writes.

The default value for dirty_background_ratio is 50% of dirty_ratio, or any value lower than 50%  of the dirty_ratio set by the admin.

for example, if you set the dirty_page ratio to be 20% and the dirty_background_ratio to be 20% as well, then the kernel will set the dirty_background_ratio to 10%.

the logic in the kernel would look something similar to this.

If ( dirty_background_ratio >= dirty_ratio )

{

dirty_background_ratio = dirty_ratio / 2

{

1 Comment

Filed under Linux

Web Performance @ Google

Performance team @ a Company 

  • Kernel, Networking, Infrastructure, Chrome, Mobile…
  • Research & drive performance web standards (W3C, etc)
  • Build open source tools, contribute to existing projects
  • Optimize Company/Product, optimize the web

What we do – 

1. The problem…
○ Trends on the web
○ Networking in the browser (HTTP, and beyond)
○ Mobile networks
2. Browser architecture under the hood…
○ Measuring performance
○ Networking, DOM, Rendering, HW acceleration
3. Best practices, with context…
○ Optimizing load time
○ Optimizing apps (FPS, memory, etc)
○ Automating optimization…


reference – http://www.igvita.com/slides/2012/webperf-crash-course.pdf

Leave a comment

Filed under Uncategorized

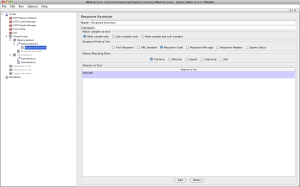
How to Assert on HTTP Response Code in Jmeter

While testing performance of web applications we would want to verify the pages are functioning as expected. But sometimes the page is too huge for the jmeter test client to download, or some times you are not concerned about the contents of the response page, rather you just want to make sure the page is delivered, i.e. there are no 404 or 500’s , but the response code is 200 OK, or redirect 302 , which ever is expected in your test scenario.

solution :

In the Response Assertion you should select “Response Code” rather than the default response, and add 200|302 if you are expecting redirect or 200 if you want to test if the page is being delivered without at issues.

1 Comment

Filed under JMeter